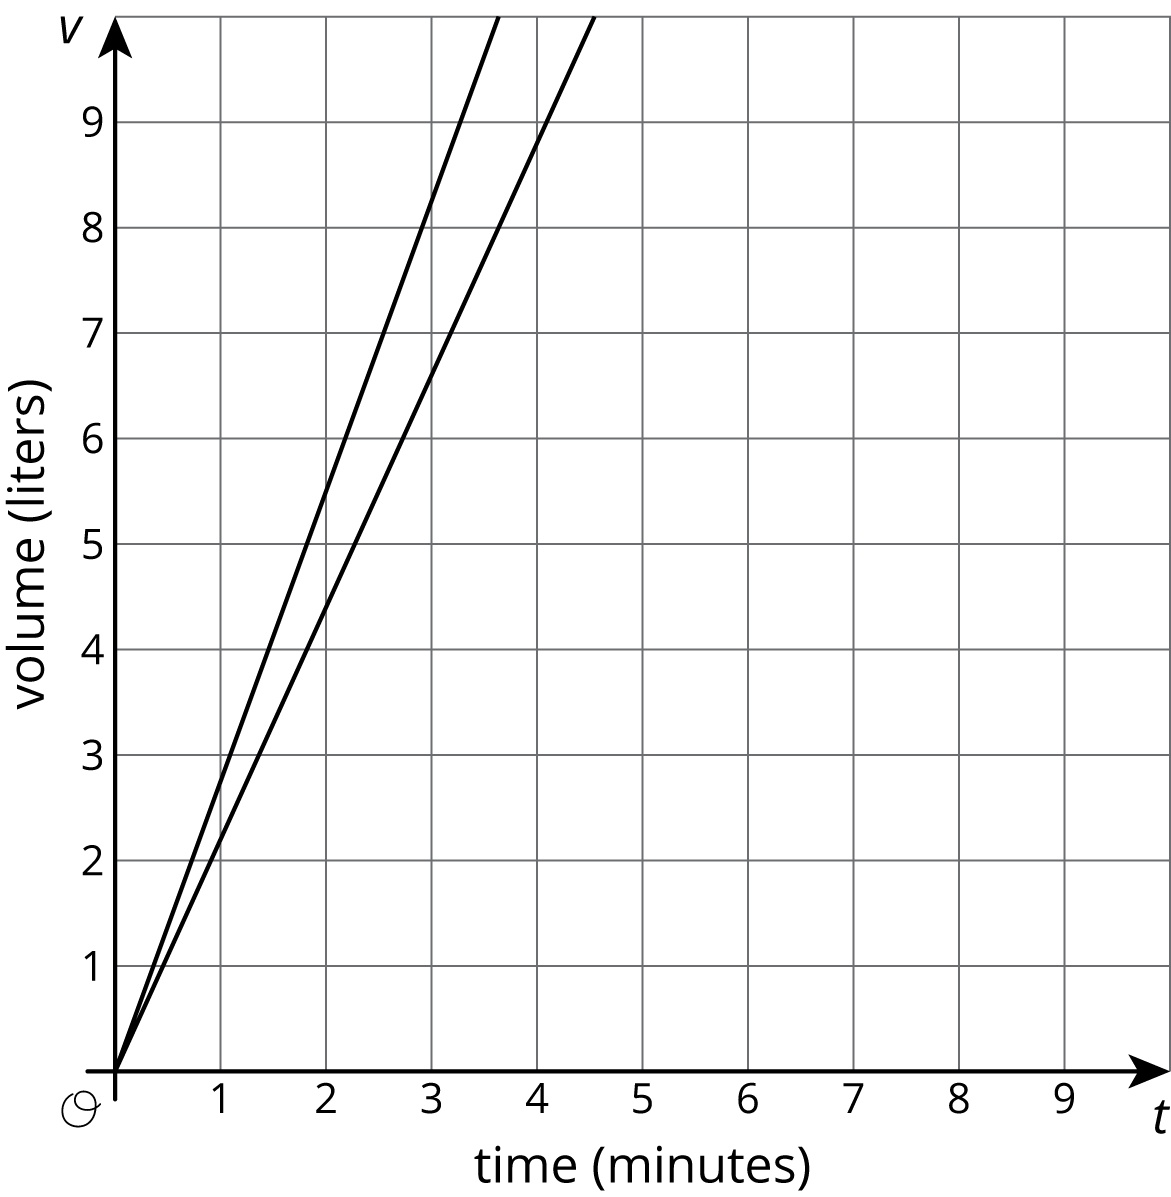
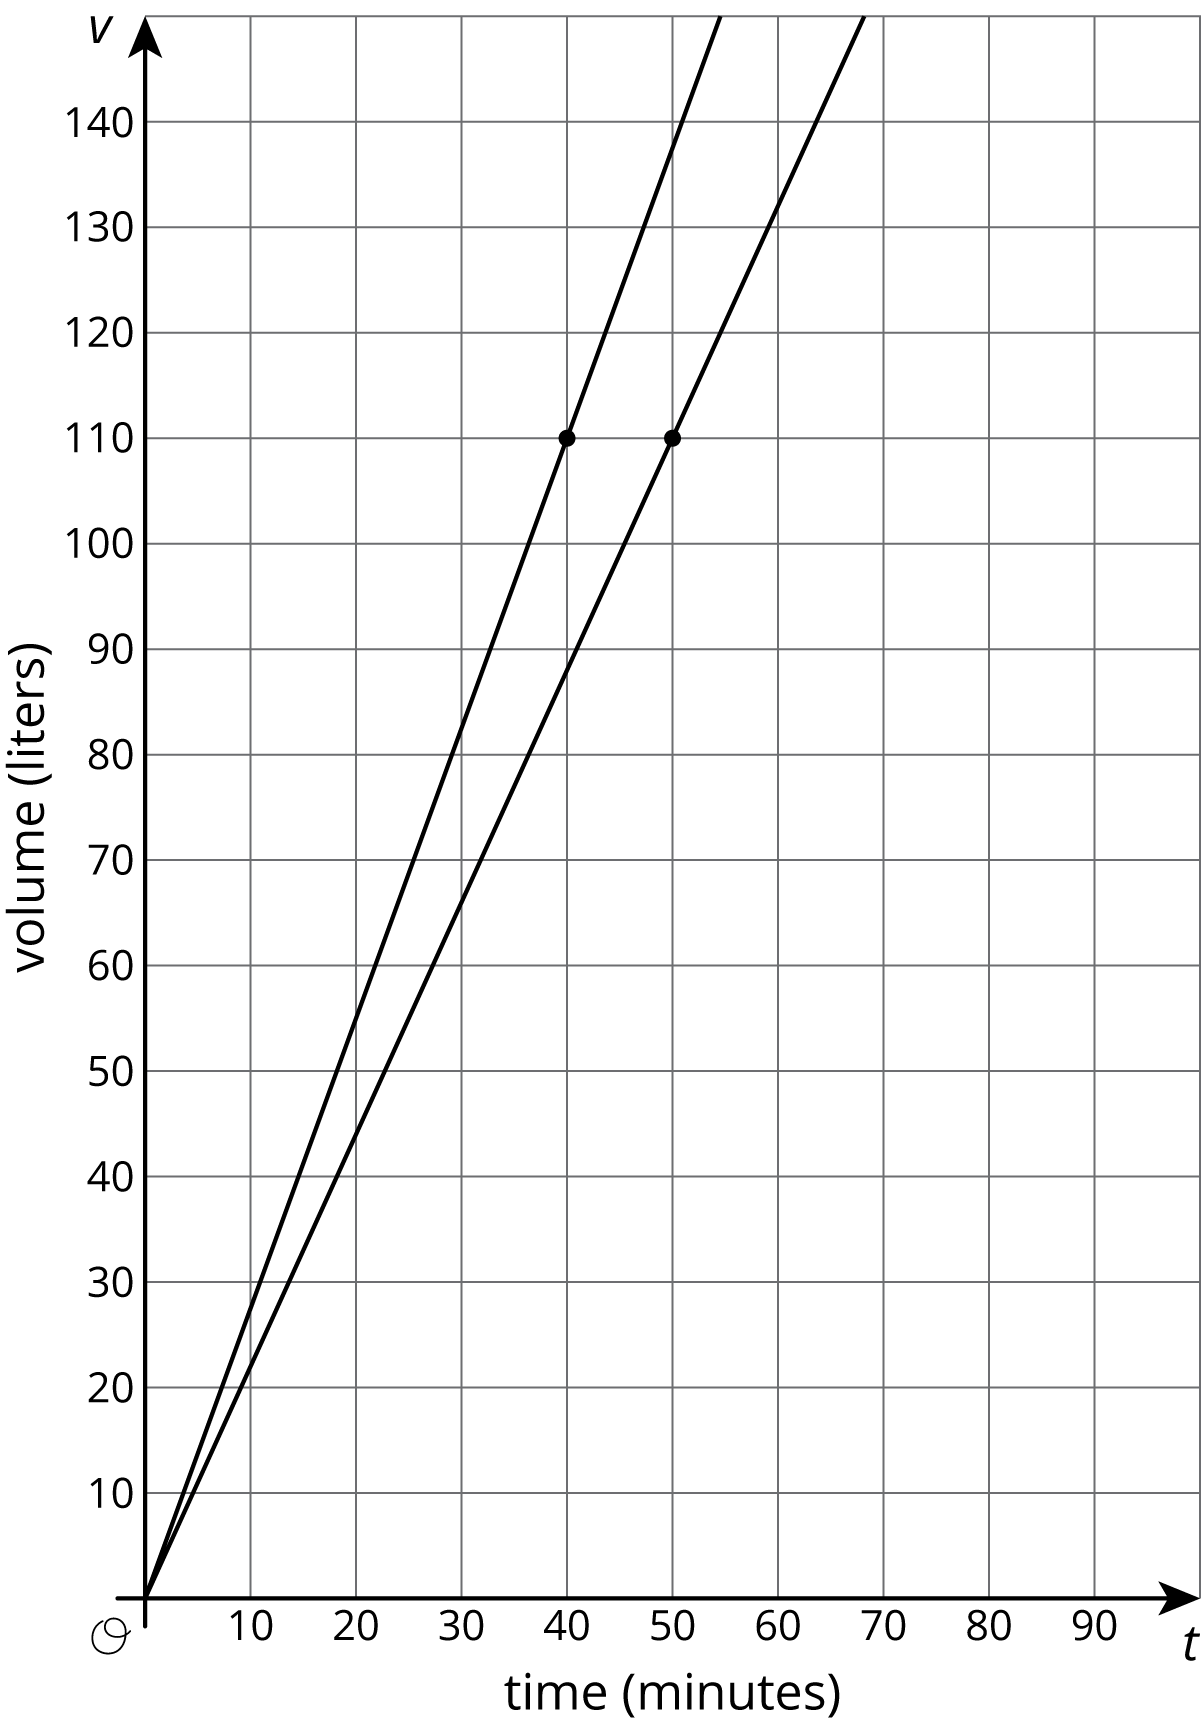
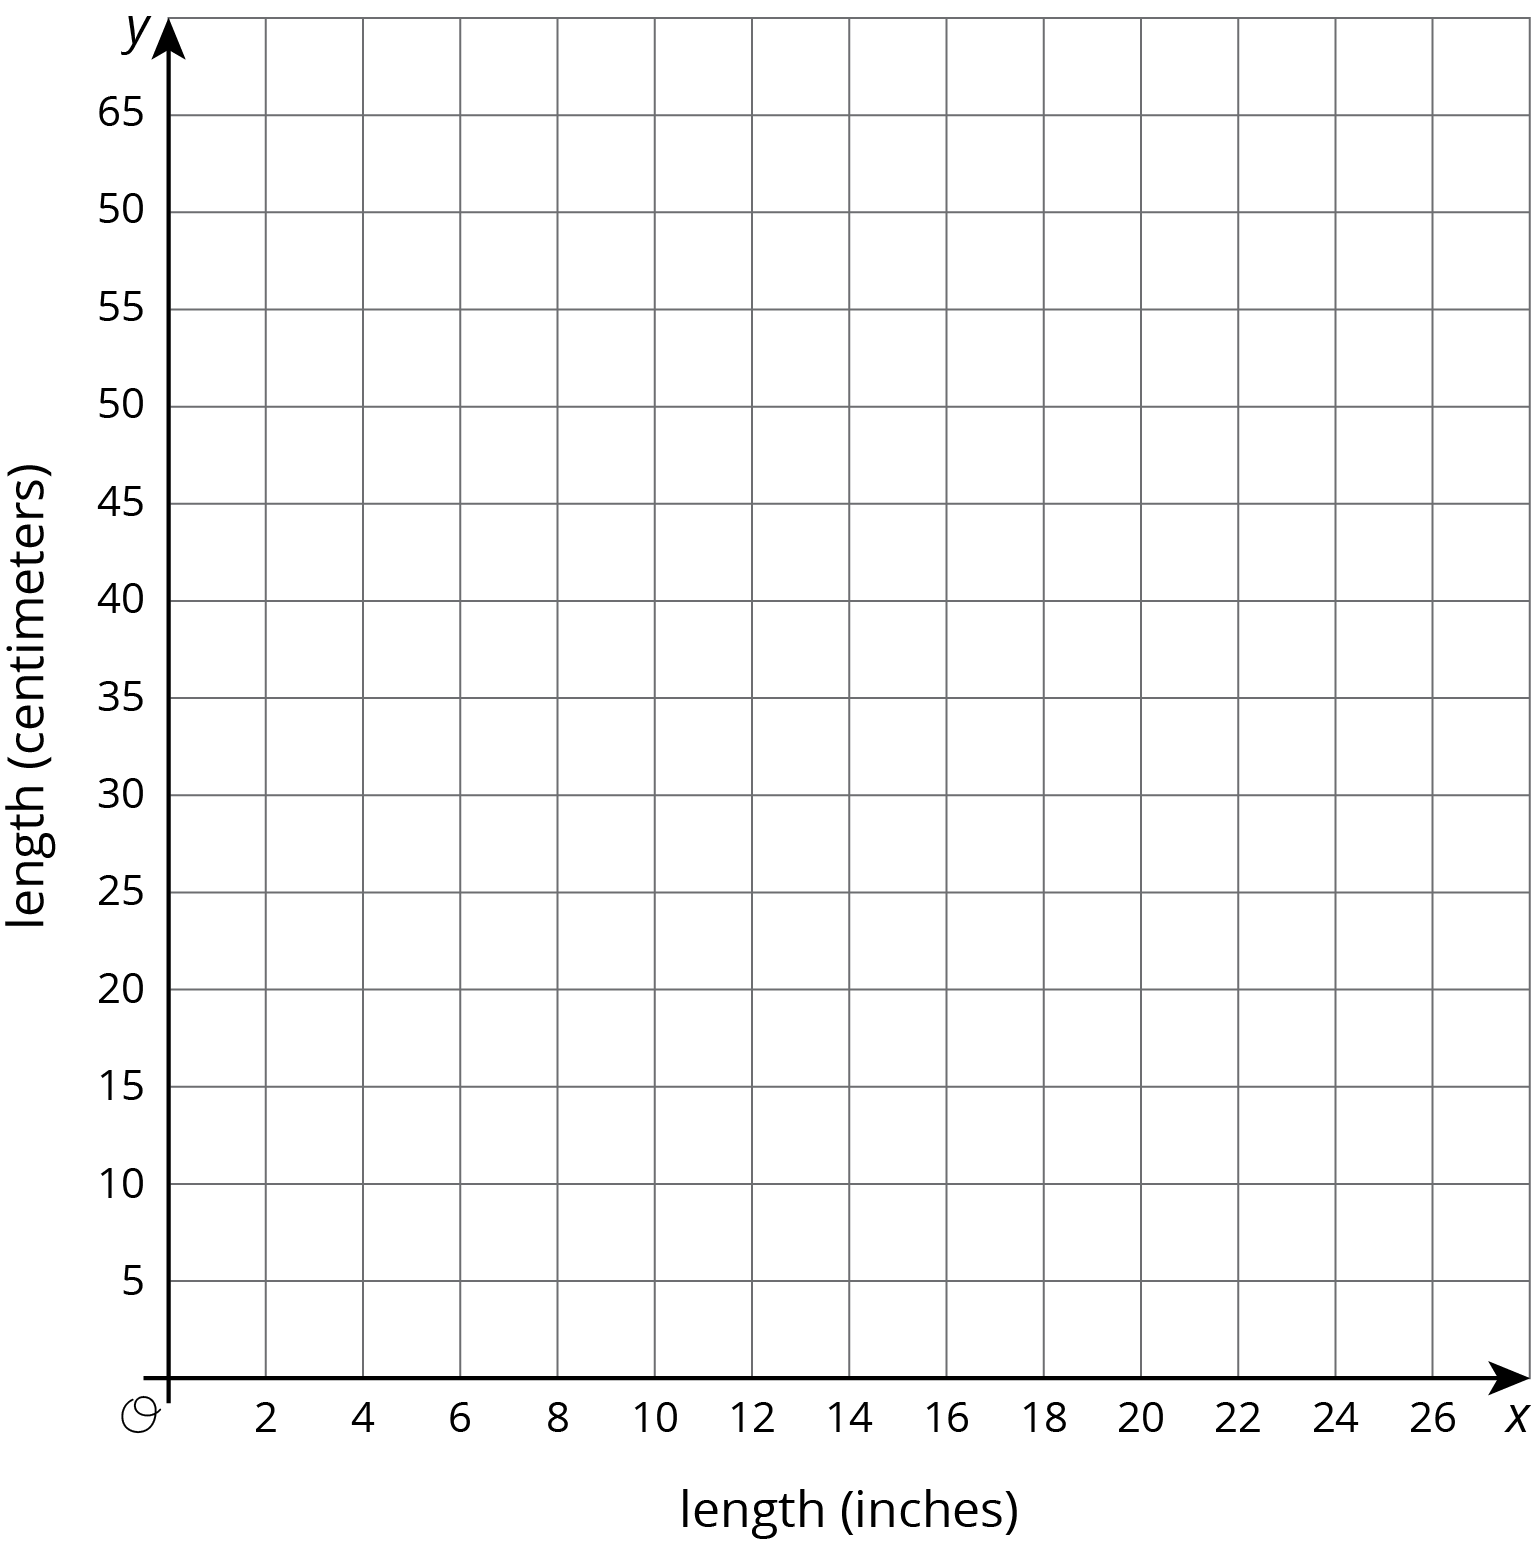
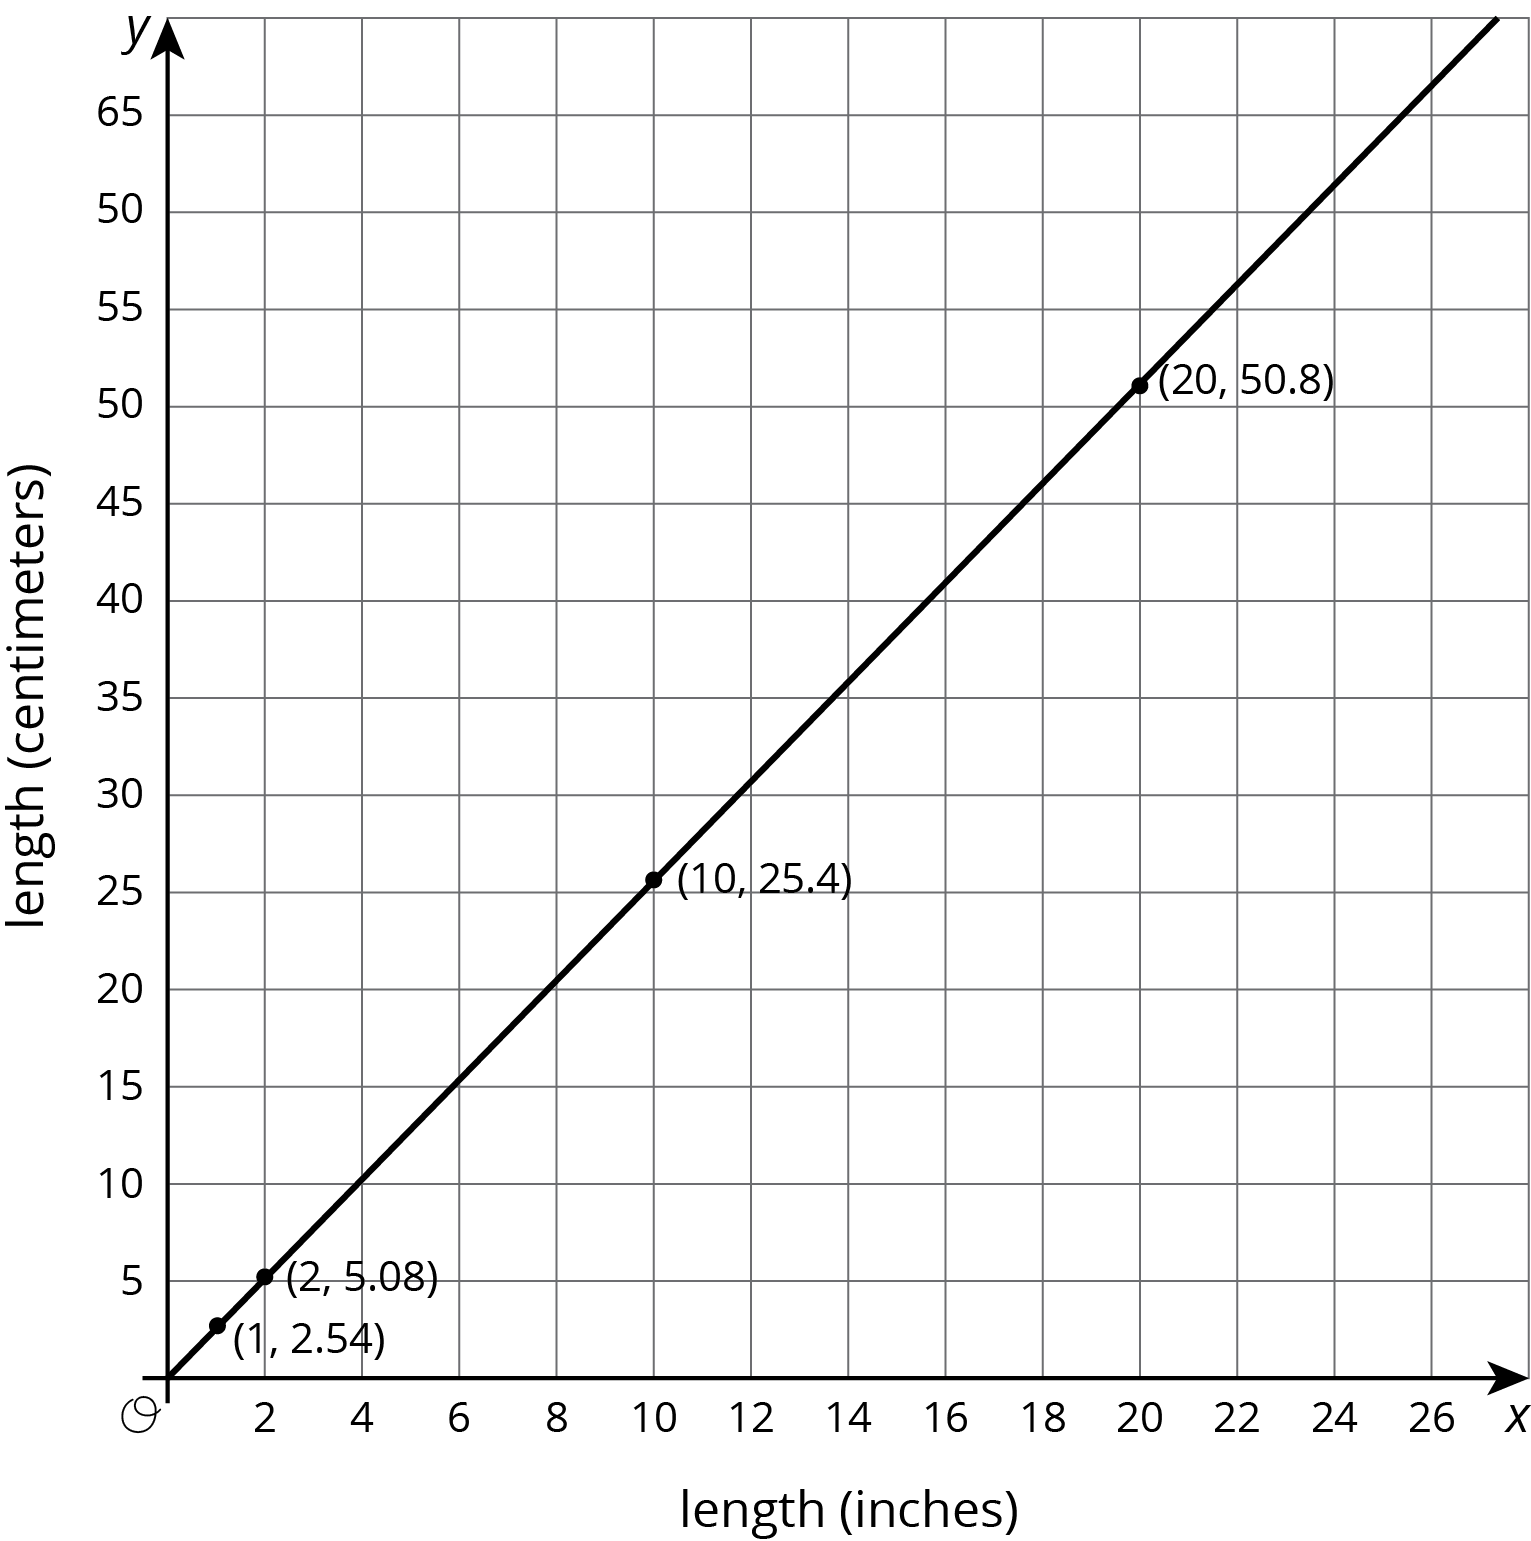
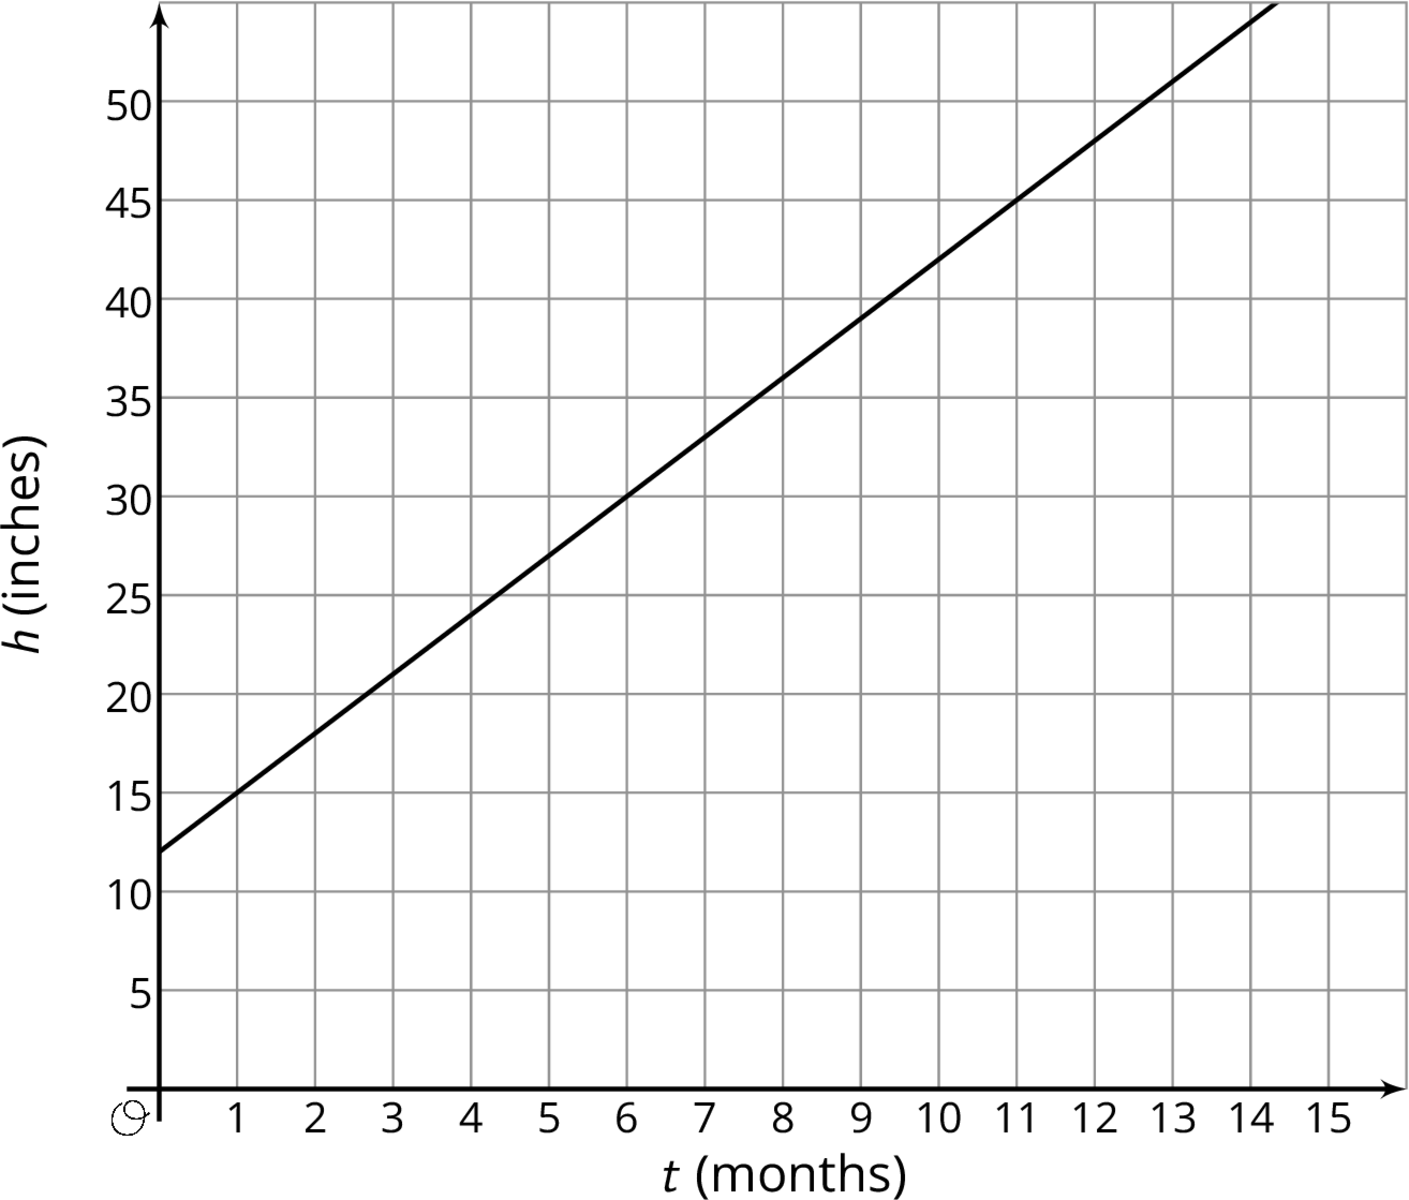
There are many successful ways to set up and add scale to a pair of axes in preparation for making a graph of a situation. Sometimes we choose specific ranges for the axes in order to see specific information. For example, if two large, cylindrical water tanks are being filled at a constant rate, we could show the amount of water in them using a graph like this:
 MONTGOMERY COUNTY PUBLIC SCHOOLS
