Mathematics Support


Chance Events and Probability Models

Students will be able to...

  • Understand that the probability of a chance event is a number between 0 and 1 that expresses the likelihood of the event occurring. Larger numbers indicate greater likelihood. A probability near 0 indicates an unlikely event, a probability around 1/2 indicates an event that is neither unlikely nor likely, and a probability near 1 indicates a likely event. 
  • Approximate the probability of a chance event by collecting data on the chance process that produces it and observing its long-run relative frequency, and predict the approximate relative frequency given the probability. 
  • Develop a probability model and use it to find probabilities of events. Compare probabilities from a model to observed frequencies; if the agreement is not good, explain possible sources of the discrepancy. 
  • Compare empirical and theoretical probability. 
  • Find probabilities of compound events using organized lists, tables, tree diagrams, and simulation. 

The Common Core State Standards require a balance of three fundamental components that result in rigorous mathematics acquisition: deep conceptual understanding, procedural skill, and mathematical applications and modeling.
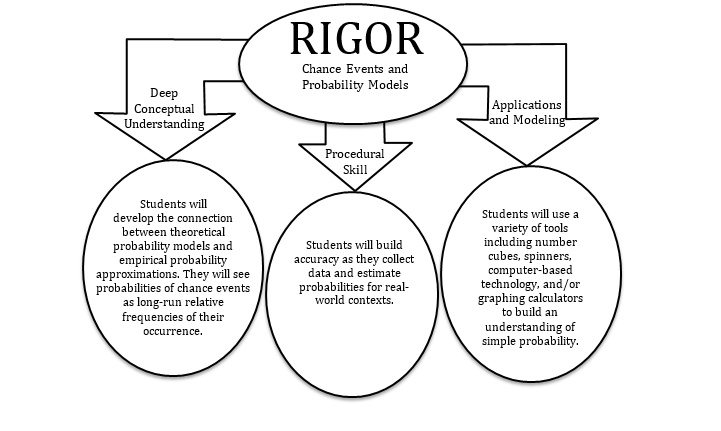
 Unit 4 Topic 1 Flowchart

In school, your child will…

  • Understand that the probability of a chance event is a number between 0 and 1 that expresses the likelihood of the event occurring. Larger numbers indicate greater likelihood. A probability near 0 indicates an unlikely event, a probability around 1/2 indicates an event that is neither unlikely nor likely, and a probability near 1 indicates a likely event.

              Likelihood line


  • Approximate the probability of a chance event by collecting data on the chance process that produces it and observing its long-run relative frequency, and predict the approximate relative frequency given the probability.
    • For one throw of a dart, what is the probability of winning a point?  Note that a point is won if the dart lands on a black square.                      
     

               Dartboard


  • Develop a probability model and use it to find probabilities of events. Compare probabilities from a model to observed frequencies; if the agreement is not good, explain possible sources of the discrepancy.    
    • A botanist is investigating one square kilometer of rainforest and discovers 70 seedlings of plant A, 80 seedlings of plant B, and 50 seedlings of plant C. The botanist is planning on randomly selecting one plant from the total sample to experiment on when she returns. 
    • Create a probability model to show how likely the botanist is to select each plant type. 
     
  • Find probabilities of compound events using organized lists, tables, tree diagrams, and simulation. 
    • Candace wants to conduct a simulation of guessing correctly on a five question true/false quiz.
    • Create a probability model and conduct the simulation to determine the likelihood of passing (scoring at least 60%) the quiz.   
     

At home, your child can…

  • Examine the long range weather forecast and discuss how the likelihood of rain varies from day to day.
  • Review the rules of a board game that uses dice and discuss the likelihood of different outcomes of occurring. For example: In Monopoly, if you throw doubles three times in succession, then you go to jail. Does this outcome occur more or less than any other outcome occurring three times in a row?

Additional Resources

*Additional Practice links support C2.0 content, but may use vocabulary or strategies not emphasized by MCPS.


Random Sampling

Students will be able to...

*Instructional videos in the hyperlinks above are meant to support C2.0 content, but may use vocabulary or strategies not emphasized by MCPS.


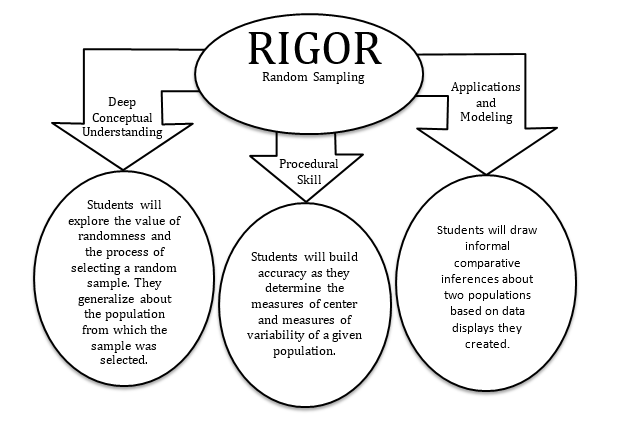
The Common Core State Standards require a balance of three fundamental components that result in rigorous mathematics acquisition: deep conceptual understanding, procedural skill, and mathematical applications and modeling.

Unit4 Topic 2 Flowchart

In school, your child will…

  • Understand that statistics can be used to gain information about a population by examining a sample of the population; generalizations about a population from a sample are valid only if the sample is representative of that population. Understand that random sampling tends to produce representative samples and support valid inferences.
    • P.R. Middle School has over 1,000 students. Members of the SGA want to survey a sample of students. Write a letter to the principal suggesting possible survey methods that can be used. Describe why they are valid and would likely produce a sample that is representative of the population.     
     
  • Use data from a random sample to draw inferences about a population with an unknown characteristic of interest. Generate multiple samples (or simulated samples) of the same size to gauge the variation in estimates or predictions. 
    •  If you had to order 500 t-shirts for the students at your school, how many medium sized shirts would you order? Why?   
     

         shirt table

  • Informally assess the degree of visual overlap of two numerical data distributions with similar variabilities, measuring the difference between the centers by expressing it as a multiple of a measure of variability.
    • What conclusions can you draw based on the two data distributions?
     
      Data distributions

At home, your child can...

  • Design and conduct a survey based on a question of interest. (Ex. The number of hours of screen time 7th graders have each week.)  
  • Design a simulation to model your survey and create multiple random samples of the same size.
  • Design a dot plot and compare the two samples. 
    • How is the sample data in your dot plot clustered?
    • Are there any gaps in the data?  
    • Is the data distribution skewed in any way? 
    • What statements can you make about the variability or spread of the data represented in your display? 
    • What similarities do you notice? What differences?  
     
  • Investigate a news article that makes inferences based on data. Discuss how large the sample is and if the inferences made are accurate. 

Additional Resources

*Additional Practice links support C2.0 content, but may use vocabulary or strategies not emphasized by MCPS.

IM 6–8 Math was originally developed by Open Up Resources and authored by Illustrative Mathematics, and is copyright 2017-2019 by Open Up Resources. It is licensed under the Creative Commons Attribution 4.0 International License (CC BY 4.0). OUR's 6–8 Math Curriculum is available at https://openupresources.org/math-curriculum/.


Disclaimer: This site provides external links and videos as a convenience and for informational purposes only. The appearance of external hyperlinks on the MCPS Family Mathematics Support Center website does not constitute an endorsement by the Montgomery County Public School System of any of the products or opinions contained therein.